Introduction
- Prometheus is an opensource monitoring and alerting tool
- Originally built by SoundCloud in 2012
- Donated to Cloud Native Computing Foundation in 2016
- Second project hosted by CNCF after Kubernetes
- CNCF graduated project
- Collects and stores its metrics as time series data
- Metrics information is stored with the timestamp at which it was recorded
- Optional key-value pair called labels are also stored
Features
- Multi-dimensional data model — allows to define and store time-series data with multiple dimensions
- PromQL — a query language to perform complex queries and calculations on metrics data
- Time-series collection — can collect metrics data from a wide range of sources, including servers, applications, and databases
- Data retention — can set retention policies on the metrics data
- Service discovery — can automatically discover and monitor new services in a dynamic infrastructure
- Exporters — different types of agents available for collecting metrics from different types of sources
- Grafana integration — can easily integrated with Grafana for visualization and custom dashboards
- Alerting — can alert stakeholders when issue occurs
Architecture

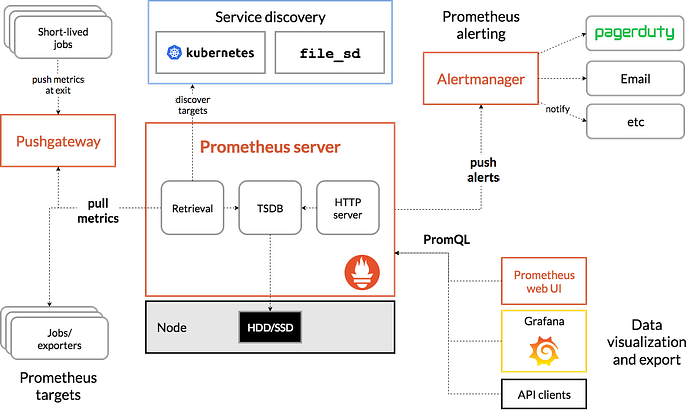
Prometheus Server
- Main component of Prometheus
- Collects, stores and serve metrics data
- Follows a pull-based model for collecting metric data
- Periodically queries the targets configured in the scrape configuration
- Uses HTTP or HTTPS protocol
- Stores the data in a time-series database
- Time-series database allows Prometheus to do operations like querying, aggregation and visualization
Exporters
- Agents that collect and expose metrics data from applications or third-party systems
- Written in a wide variety of programming languages
- Designed to be lightweight and easily to deploy
- Scrape metrics data from a target and expose it on a HTTP endpoint
- Metrics data is returned in a text-based format such as plain text, JSON, or protobuf
- Official exporters are maintained by Prometheus GitHub Organization like Node Exporter, MySQL Exporter etc
- Unofficial exporters are externally contributed and maintained like Apache Exporter, PostgreSQL Exporter etc
Alertmanager
- Manages alerts generated by Prometheus
- Receives alerts from Prometheus and groups them based on criteria like severity
- Based on routing rules, it sends notification to various receivers like Email, Slack, Pagerduty etc
- Applies a set of deduplication rules to ensure that alerts are not sent multiple times for the same issue
- Provides web interface that allows users to view and manage alerts
Pushgateway
- Prometheus follows a pull-based model for collecting metrics data
- Sometimes we need to push metrics to Prometheus which cannot be scraped
- Helps to push metrics to Prometheus instead of pulling metric
- Best suitable for short-lived jobs
- Provides a HTTP API for pushing metrics from short-lived jobs
Service Discovery
- Process of identifying and monitoring systems automatically
- Helps Prometheus to keep track of different services which are running
- Supports variety of service discovery options for discovering scrape targets like Kubernetes, Consul, Docker etc
- If you need a service discovery system that currently not supported, we can use file-based service discovery
- Enables you to list scrape targets in a JSON file along with metadata
- Metadata is piece of useful information about targets, like name of the service, description etc
- HTTP service discovery helps to discover targets over an HTTP endpoint an alternative to file-based service discovery
Client Libraries
- Set of libraries that allows developers to instrument their applications to expose metrics to Prometheus
- It exposes an HTTP endpoint and Prometheus can scrape metrics from these HTTP endpoints and store them in time-series database
- Once the metrics are stored, Prometheus can generate graphs, reports and alerts based on the data
- Helps developers to get insights about their application performance
- Official client libraries are available in many programming languages like Go, Python, Java etc
- Unofficial client libraries are also available for C, C++, Node.js etc

